January 9, 2018
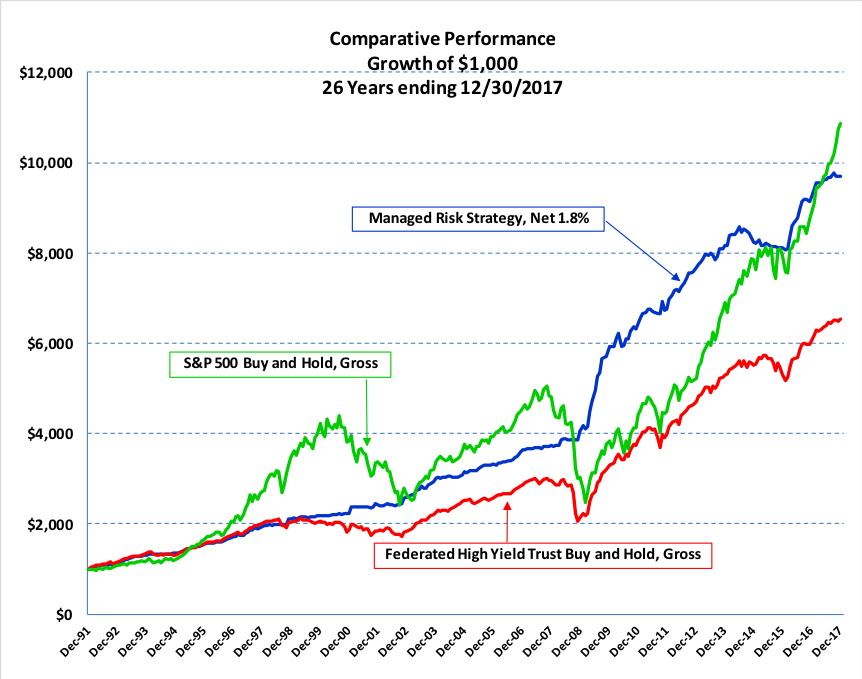
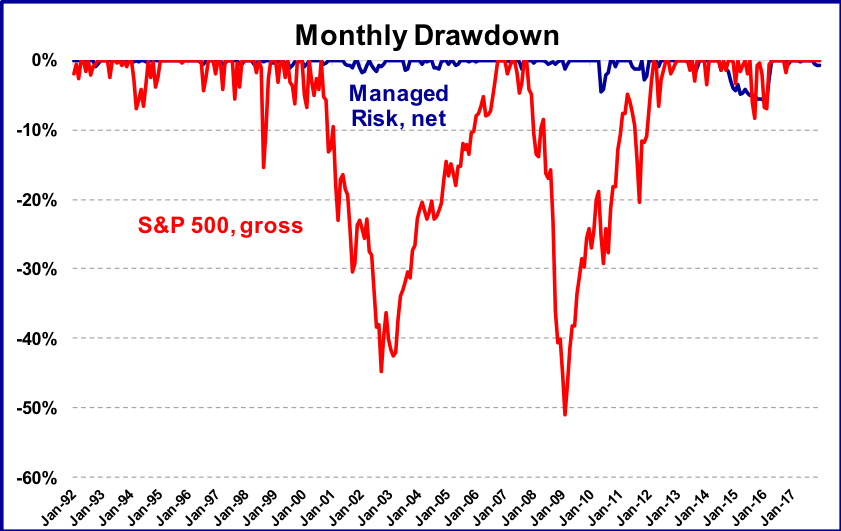
Since April of 2014 Trendhaven has been managing client accounts in a strategy that has just completed its 26th year. The tactical approach using high-yield bond funds has been very successful in achieving its absolute return investment goal. Only one calendar year had a slightly negative return, and maximum drawdown net of fees has been held to only 5.9%. This degree of loss mitigation was achieved during a period that included several market corrections, two of which were some of the most severe ever seen. Many believe we are late in the cycle of investment returns for risk assets. If so, our approach should prove to be a timely alternative to passive investing.
Because high-yield bonds and stocks are both reflections of the promise of future economic conditions, comparisons are ultimately made. In 2017 the stock indexes continued their meteoric rise, while the high-yield bond advance moderated, in what may be a harbinger for stocks. We ended 2017 with a return of 4.6%, net of fees. Over the 26-year life of our strategy, annualized return (net of fees) are on a par with the S&P 500 index (gross of fees), even as that index continues to set new record highs. The difference being that our approach did it without all the gut-wrenching drama of huge declines and long recoveries.
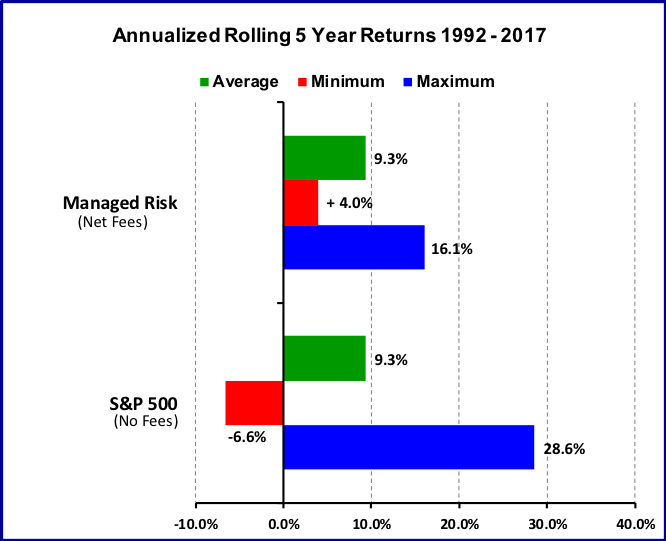
The steady gains and very low drawdown of our strategy facilitates long term investment. By contrast, most investors would not have stayed invested in the S&P 500 through its tumultuous run, and thus would not have realized the 26-year implicit gains. It may be more reasonable to compare rolling five year returns during this 26 year period.[1] Remarkably, the average annualized return of our strategy and that of the S&P 500 using this rolling five-year method is the same 9.3%. Significantly, the minimum rolling annualized return of the S&P 500 was -6.6%, while the minimum for our tactical approach was +4.0%.
Because most investors are reluctant to commit to a full allocation to stocks, they attempt to mitigate the risk of loss through diversification. This usually takes the form of diversified portfolios that are some spin on a 60/40 stock/bond allocation. So a review of past performance wouldn’t be complete without taking a look at how a simple 60/40 portfolio performed during both of the last two major market corrections and subsequent recoveries, compared to our managed tactical approach. As you can see, holding onto a well diversified 60/40 stock/bond portfolio during these times would have taken a toll on an investor’s patience. Recovery from the next correction may not have the benefit of the central bank monetary policy juice provided the last time. Moreover, the longer term benefits of avoiding the lion’s share of the corrections via active management are significant.
Those who have benefited from this extended bull market might consider taking some risk off the table in 2018. An allocation to a proven absolute return investment approach should be considered.
Performance of the Managed Risk Strategy shown net of 1.8% annual advisory fee taken quarterly in advance, and includes reinvestment of dividends. Performance of any other indexes, securities or portfolios are shown gross of advisory fees, unless otherwise indicated. Trendhaven began implementing the strategy in separate accounts in April 2014. Performance of the strategy before that time is that of the owner / licensor of the same quantitative analytic used by Trendhaven. Performance 1994-2012 verified by Rothstein Kass. Performance 1992, 1993 and 2013 to present verified by Theta Research. Interested investors may request and receive the trade dates, securities used, purchase, sell and recent prices in implementation of the strategy over the past year. It should not be assumed that recommendations made in the future will be profitable or will equal the performance of the securities in this list. All investment involves the risk of loss. Past performance does not necessarily predict future returns.